The Problem
Onset detection asks a simple question: where are the beats? Given only the raw audio of a song, the model has to mark each moment a new note or hit begins, and from those, work out the tempo. It’s a core task in music information retrieval, and it sits underneath things like beat tracking, DJ software, and rhythm games.
We worked with the Ballroom dataset: 698 thirty-second excerpts across eight dance styles, each annotated with every beat and the track’s tempo. After converting the annotations to CSVs and caching per-track metadata (sample rate, style, length), we split the tracks into training and testing sets (140 test tracks) so every number below comes from audio the model never tuned on.
Measuring Success
We followed the evaluation standards from MIREX (the Music Information Retrieval Evaluation eXchange). A detected onset within ±50 ms of a real beat is a true positive, a beat with no detection nearby is a false negative, and a detection with no beat nearby is a false positive. From those we computed:
- Precision: how many detected onsets were real beats
- Recall: how many real beats were detected
- F1 score: the harmonic mean of the two, which is what we optimized
Baseline Model
The baseline uses a novelty function: the first derivative of each track’s RMS energy (1024-sample frames, 512-sample hop), with negative values trimmed, since only increases in energy suggest a new onset. Any peak above a threshold counts as a detected beat.
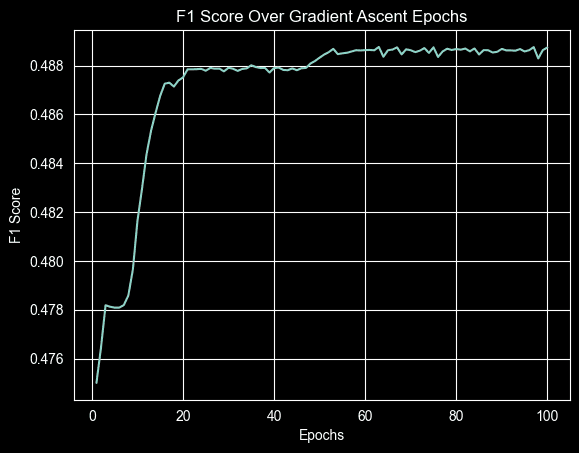
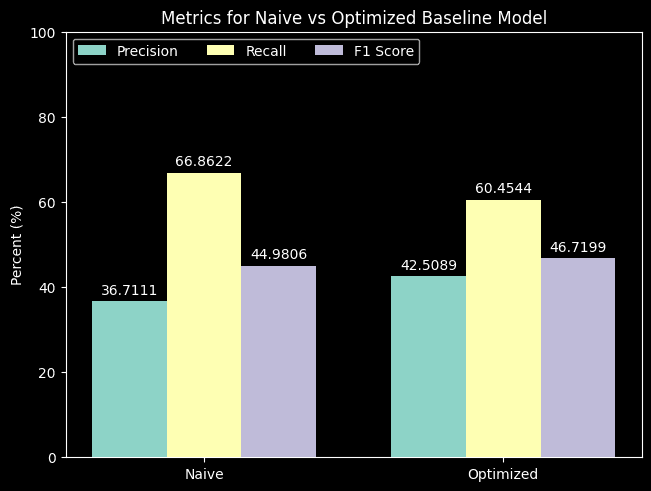
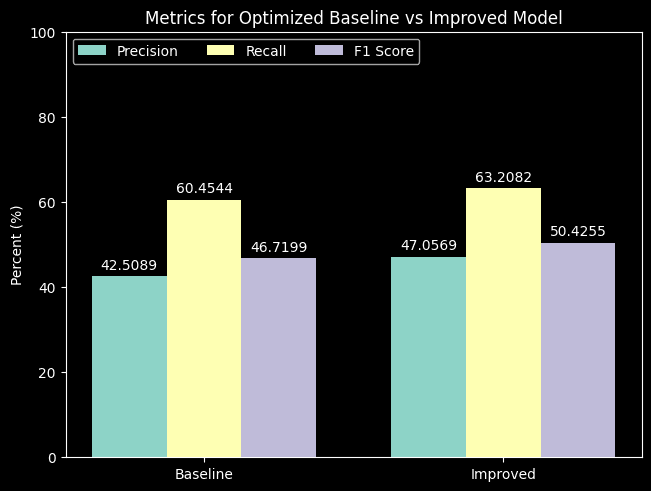
A hand-picked threshold of 0.03 gave an F1 score of 45.0%. Rather than brute-forcing every value, we wrote a gradient ascent loop that nudges the threshold, measures how the average training F1 changes, and steps in the better direction. It settled on 0.03729, raising test F1 to 46.7%.
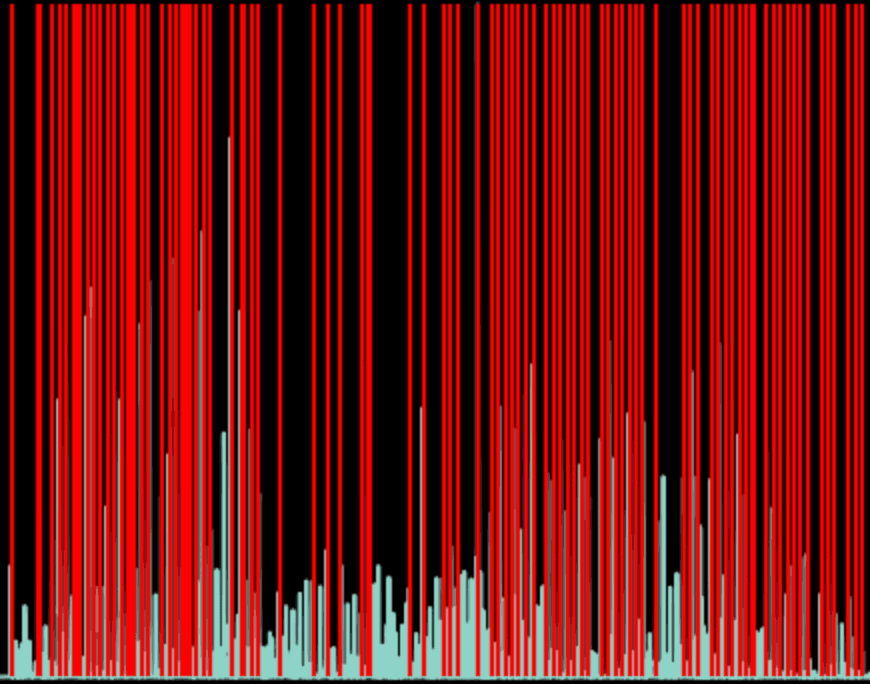
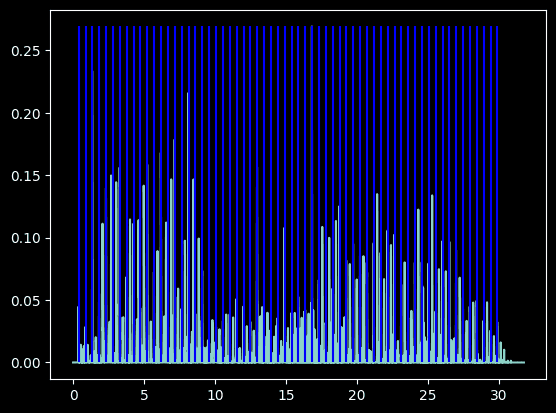
Plotting the novelty function against the ground truth showed the baseline’s weakness: some of its tallest peaks don’t land on beats at all, and many real beats sit on tiny peaks. Energy alone isn’t enough.
Improved Model
Feature selection
To give the model more to work with, we extracted several new features for every track: spectral flux (changes in the spectrum, not just loudness), the squared derivative of the zero-crossing rate (changes in rough pitch), and the derivatives of 20 Mel-frequency cepstral coefficients (changes in timbre). Each one was tested on its own as a novelty function, with its threshold tuned by the same gradient ascent.
Only MFCC 0 beat RMSE on its own, but the top three (MFCC 0, RMSE, and spectral flux) capture different kinds of change, so we combined them.
| Feature | Test F1 (alone) |
|---|---|
| MFCC 0 ✓ | 0.481 |
| RMSE (baseline) ✓ | 0.467 |
| Spectral flux ✓ | 0.380 |
| MFCC 3 | 0.351 |
| MFCC 2 | 0.333 |
| Zero-crossing rate | 0.278 |
Top six of 23 features tested; ✓ marks the three combined into the improved model.
Weighting the features
Simply adding the three normalized features (with a fixed 0.5 peak threshold) actually scored slightly lower than the baseline. The fix was a weighted sum. A grid search over weight combinations found a strong starting point of (1.4, 1, 1.4) for RMSE, spectral flux, and MFCC 0, and then we extended the gradient ascent to multiple variables: each epoch nudges every weight individually, measures its effect on F1, and moves along the resulting gradient. The final weights were (1.595, 0.893, 1.630).
Results
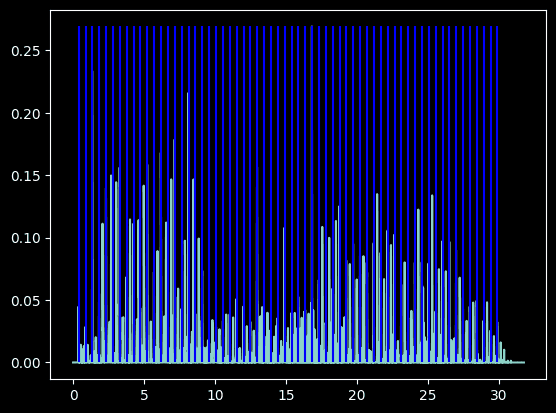
On one percussion-heavy test track, the difference is easy to see. Blue lines are the true beats and red lines are detections. The improved novelty function lines up with the beat grid far more cleanly, and on this track F1 rose from 59.5% to 65.4%.
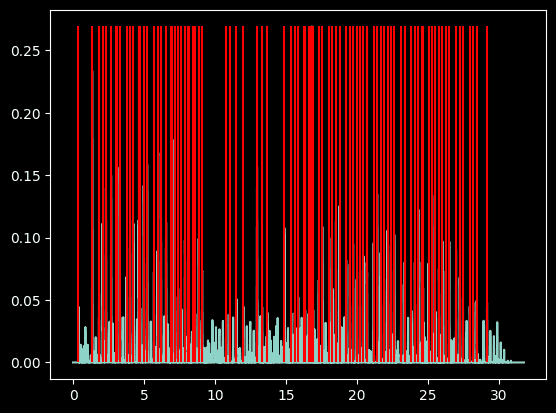
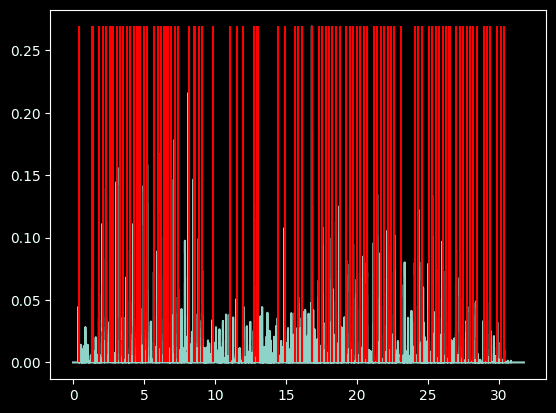
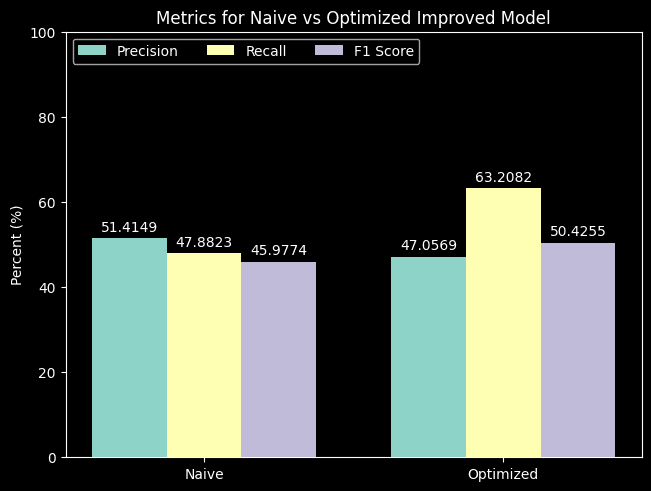
Across the full test set, both optimized models involved a precision/recall trade-off on their own, but the improved model beats the baseline on all three metrics at once, because it changes what the model listens to rather than just how sensitive it is.
Extension: Tempo Estimation
With a better novelty function in hand, we used it to estimate tempo. Autocorrelating the novelty function shows how strongly it repeats at each lag; converting lags to BPM (using the hop length and sample rate) gives a beat histogram, whose peaks are candidate tempos. The naive model picks the strongest peak between 40 and 300 BPM.
Counting an estimate as correct within 8% of the true tempo (the MIREX standard), the naive model got 36.4% of test tracks right.
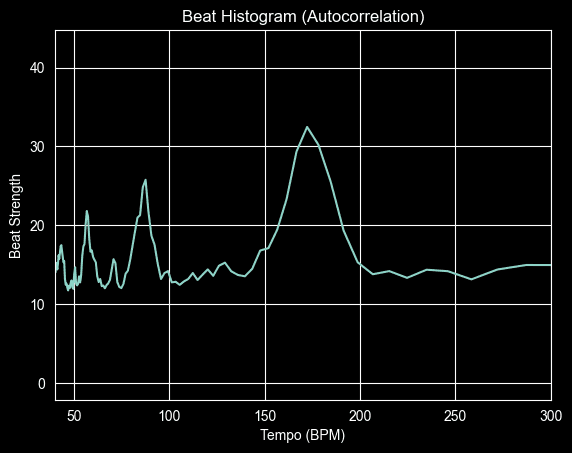
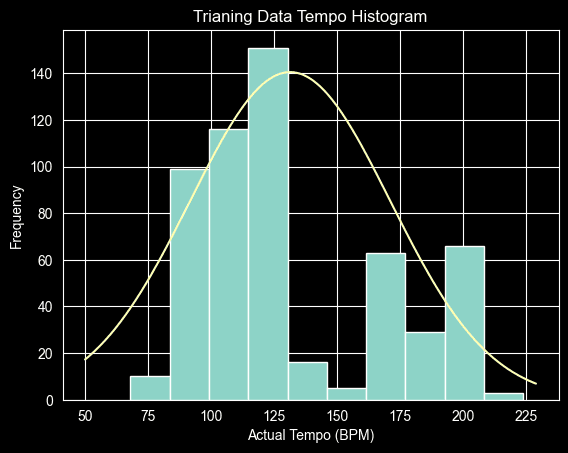
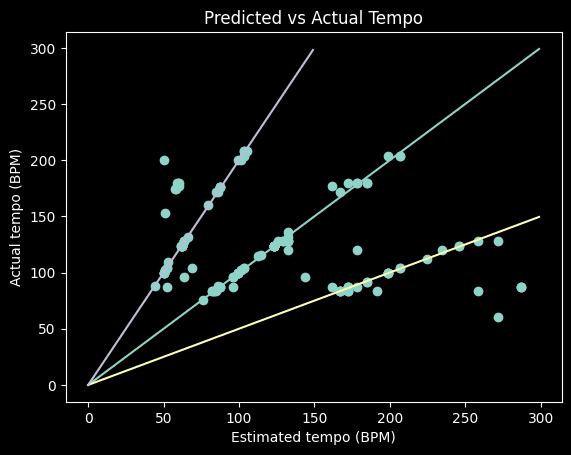
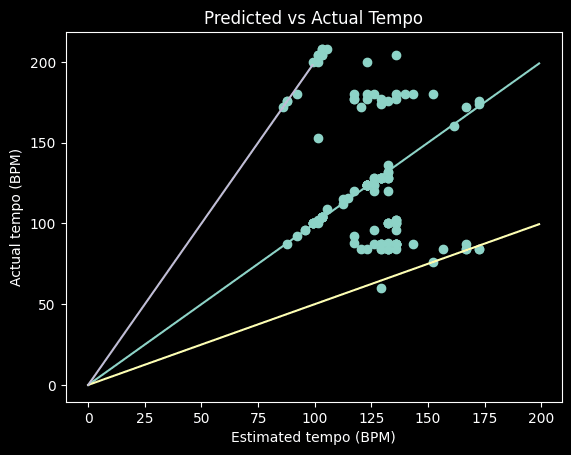
The scatter plots showed most errors were tempo doubling and halving: the model locked onto every other beat, or onto subdivisions, and those wrong answers sat at the extreme ends of the range. To counter that, we fit a normal distribution to the training tempos and used it to re-weight each peak’s confidence, so common tempos win close calls.
That raised accuracy to 45.7%, a gain of over 9 percentage points.